The Custom Report Builder
When none of the built-in reports answers your question, build your own: pick the data, narrow it, group it, chart it, and save it so it runs on demand or on a schedule.
A custom report is a saved definition, not a one-off export. Once saved it behaves like any built-in report — you run it, export it, schedule it, and share it — and it re-queries live data every time, so last month's report reflects this month's corrections.
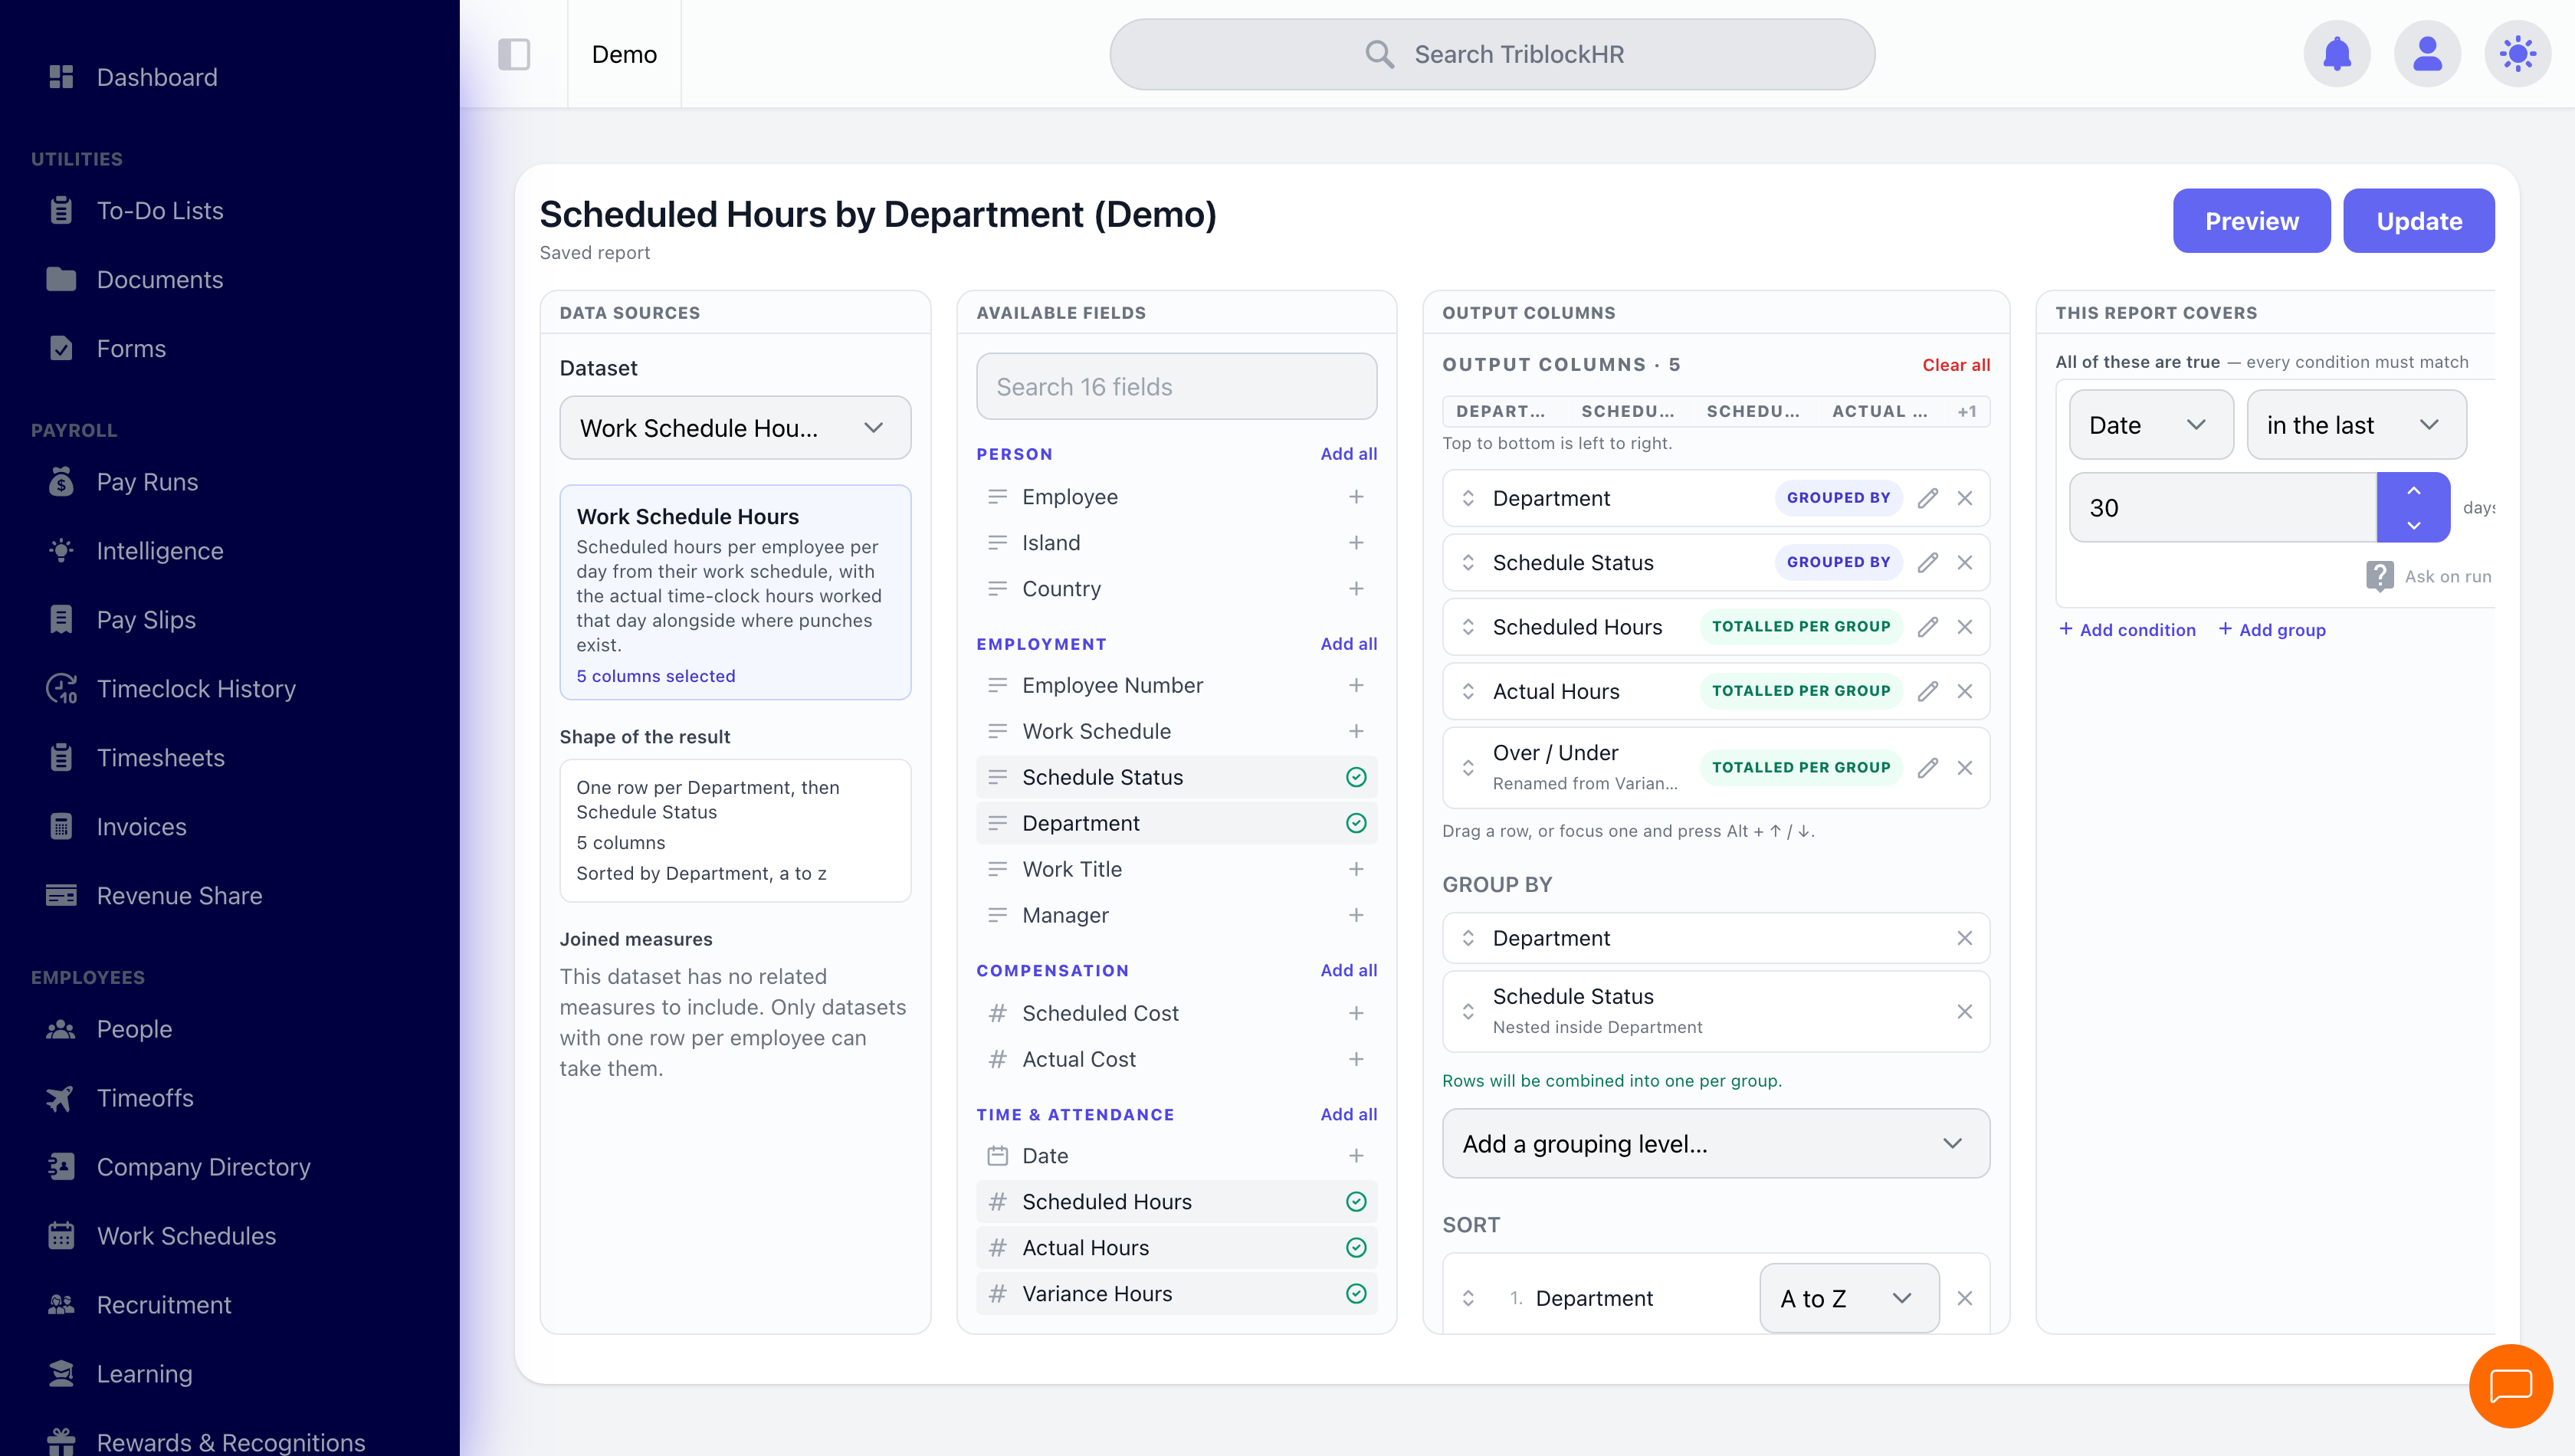
The builder, whole screen
Save as: admin-guide__reports__custom-reports__shot1.png
Who can build one
The builder is an administrator tool. Employees never see custom reports — not the builder, not the "Create custom report" action, and not saved reports shared with the account.
Some datasets carry payroll-sensitive figures and are limited further, to Payroll and HR Administrators. If a dataset doesn't appear in your list, that's why — your role can't reach that data anywhere in the platform, and a report is no exception. See Roles & Permissions.
Anatomy of a report
Every custom report is built from the same seven parts:
| Part | What it decides |
|---|---|
| Name | What it's called in the reports list. Name it for the question it answers — the field even suggests "e.g. Headcount by Department". |
| What is this report for? | Optional description. Worth filling in on anything shared or scheduled — "Sent to BICCU each month for payroll deductions" saves the next person guessing. |
| Dataset | Which table of data you're reporting on. This is the one choice you can't casually change later — it determines every column available. |
| Output Columns | The fields that appear, chosen from Available Fields. Top to bottom in the list is left to right in the result. Charts can only use columns the report includes. |
| This report covers | Which rows qualify — the filter pane, headed "All of these are true — every condition must match". |
| Group-by | Collapses rows and aggregates the numbers — up to three levels, each labelled with what it sits inside ("Nested inside Department"), and the pane confirms "Rows will be combined into one per group." |
| Sort | Row order, per column — A to Z or the reverse. |
| Charts | Optional visuals over the same data — as many as you like, in the order you arrange them. |
The builder lays these out as panes side by side. Available Fields is searchable and grouped by business area — Person, Employment, Compensation, Time & Attendance — with an Add all per group, so you look where a field belongs rather than hunting an alphabetical list.
Each chosen column can be renamed; the row then shows "Renamed from…" so the original is never lost. Columns also carry badges telling you how they behave: GROUPED BY or TOTALLED PER GROUP. Reorder by dragging, or focus a row and press Alt + ↑ / ↓.
Data Sources shows the dataset with a plain-English Shape of the result — "One row per Department, then Schedule Status · 5 columns · Sorted by Department, a to z" — which is the quickest way to confirm you built what you meant.
Preview runs the report against real data whenever you want to check your work; Update (or Save on a new one) commits it. A preview is a sample rather than the finished figure — see Reading the preview for what it tells you about itself.
Building one, step by step
- From Reports, click Create custom report.
- Give it a Name.
- Choose the Dataset (see the list below). The column picker repopulates from your choice.
- Pick your Columns. Start with the few you'd actually read; you can add more once the shape looks right.
- Add Filters to narrow the rows.
- Optionally set a Group-by and a Sort.
- Optionally add Charts.
- Check the Preview, then save with a visibility.
Datasets
There are 32 to choose from. A dataset is the grain of your report — one row per employee, per punch, per payslip line, and so on. Choosing the right grain is most of the work.
| Area | Datasets |
|---|---|
| People | Employees, headcount trend, attrition rate, retention rate, promotion rate, band drift |
| Time & attendance | Time entries, punch records, punch attempts, work-schedule hours, employee shifts, absenteeism rate |
| Leave | Leave usage, leave adjustments |
| Recruitment | Applicants, open positions, time to hire, hiring turnaround, offer acceptance rate |
| Employment history | Employment history — promotions, transfers, terminations and rehires with their effective dates and before/after values |
| Performance & learning | Performance reviews, course progress |
| Recognition | Recognitions given and received, with points |
| Documents & forms | Documents, questionnaire responses |
| Payroll (Payroll/HR Administrators only) | Pay-run lines, tax contributions, allowance history, deduction history, salary scales, employee bank accounts |
The work-schedule dataset is a useful one to know: it brings Work Schedule, Schedule Status, Scheduled Hours and Scheduled Cost, which is how you compare what you rostered against what you paid.
Joined measures
Joined measures bolts extra figures — hours, leave, time-clock — onto a report without changing its dataset. It's only offered where it makes sense: datasets with one row per employee. On a per-day or per-transaction dataset the section tells you plainly that there are none to include.
Filters
Filters decide which rows qualify. Each row is a column, an operator, and a value; stack as many as you need.
The set as a whole reads as All of (every condition must hold) or Any of (one is enough) the following — the equivalent of AND and OR. + Add condition adds a row; + Add group nests a whole sub-set with its own All-of/Any-of, which is how you express "in Nassau, and either hourly or on contract".
| Operator | Use it for |
|---|---|
| is / is not | Exact matches on a value or a picked option. |
| contains / starts with | Partial text — a title fragment, a name prefix. |
| > ≥ < ≤ | Numeric and date thresholds. |
| between | A range, bounds included — pay between two figures, a date window. |
| in / not in | Several accepted values at once, without stacking rows. |
| is empty / is not empty | Finding gaps — missing tax IDs, no bank account, no manager. |
| within last N days | A rolling window on a date column — the filter a scheduled report usually wants. |
A condition can also be set to Ask on run — instead of hard-coding the value, the report prompts for it each time it runs. One saved report then answers "which department?" for every department, rather than needing a copy per team.
Whoever opens that report sees the questions in a panel headed Asked each run at the top of the results: one input per asked condition, and a Run button. Answering changes only the values the author opened up — the structure, the other conditions and the dataset's own constraints stay as saved, and running with a different answer never edits the report. Two people can hold different answers on screen at the same time without affecting each other or the saved definition.
Where a report covers a period, you can use a preset — Yesterday, Month to Date, Quarter to Date, Year to Date, Last 12 Months — or Custom Range. Presets are relative, so a scheduled report keeps meaning the same thing each time it runs. Yesterday runs to the end of yesterday like every other preset, which makes it the one to pair with a daily schedule: a report that runs each morning covers the whole of the day before rather than a partial one.
Conditions the dataset always applies
Some datasets carry their own built-in constraints. These appear above your filters with a padlock and the words Always applied, written out in the same plain language as your own conditions — and you can't edit or remove them. They're shown rather than hidden so a total that looks short has a visible explanation instead of being a mystery.
Filter values read as words, not codes: a department filter shows the department's name rather than its internal ID, so a saved report still makes sense to whoever opens it next.
Employment level, across the datasets
Employment level is now available to filter and group by on many more datasets — performance reviews, recognition, salary scales, tax contributions, time entries, scheduled hours, and the punch datasets among them. It is the dimension most often needed to split a report the way an organisation actually pays people (full time, part time, contract, casual), and previously you had to approximate it with department or work title.
Report warnings
Before a report runs, the builder tells you what it's actually going to do. Two kinds of message appear:
- Blocking (red) — the report can't run as configured. Fix it before saving.
- Advisory (amber) — it will run, but something probably isn't what you meant.
These exist because two mistakes used to be invisible until the results arrived, if at all: grouping quietly changes which columns come back, and a filter left without a value quietly matches nothing. Read the warnings before you trust a total.
Reading the preview
The preview tells you what it is actually showing, which matters because it is a sample and a total is not.
| What you see | What it means |
|---|---|
| Showing an earlier answer with Run again | You changed the report after the preview ran, so the rows below are from the previous version. The numbers are real, just not current — run it again before trusting them. |
| "Showing the first N rows" | The preview is capped. Totals and charts still count every matching row, so they deliberately won't add up to the rows in the table. This is the single most common reason a preview looks inconsistent with itself. |
| "…hidden because your role cannot see…", and · hidden on the column heading | A column your role isn't allowed to read — salary, most often. The rows still count. A headcount or an average is computed over everyone who matched, including the people whose figures are hidden from you, so the total is right even though the column is blank. |
Charts
A report can carry charts as well as a table. Click Add chart and configure each one; use Move chart up / Move chart down to order them.
| Setting | What it does |
|---|---|
| Title | The chart's heading. Required. |
| Type | KPI tile (a single headline figure), Bar, Line, Area, or Pie. |
| Measure | What to compute: Count of rows, Sum, Average, or Median. |
| Of column | Which column the measure applies to (not needed for a row count). |
| Group by | The axis or slices — department, month, work title, and so on. |
| Break down by (optional) | Splits each group into series, so a bar per department becomes a bar per department per division. |
| Compare to previous (optional) | Draws the preceding period alongside the current one, labelled Current and Previous — "this month vs last" without a second report. This control only appears when you group the chart by a date column; there is no previous period to compare against when the axis is departments. |
Showing a breakdown: stacked or small multiples
Once a chart has a breakdown you choose how to show it:
- Stack series — the series sit on top of one another in one chart. Best for reading the total while still seeing the mix.
- Small multiples — one panel per series, shared scale, as the control itself puts it. Best for comparing shapes across series, because the shared scale keeps the panels honest.
They're alternatives, not a combination — pick one. Both need a breakdown column to exist first, and a KPI tile or Pie can't be broken into series at all.
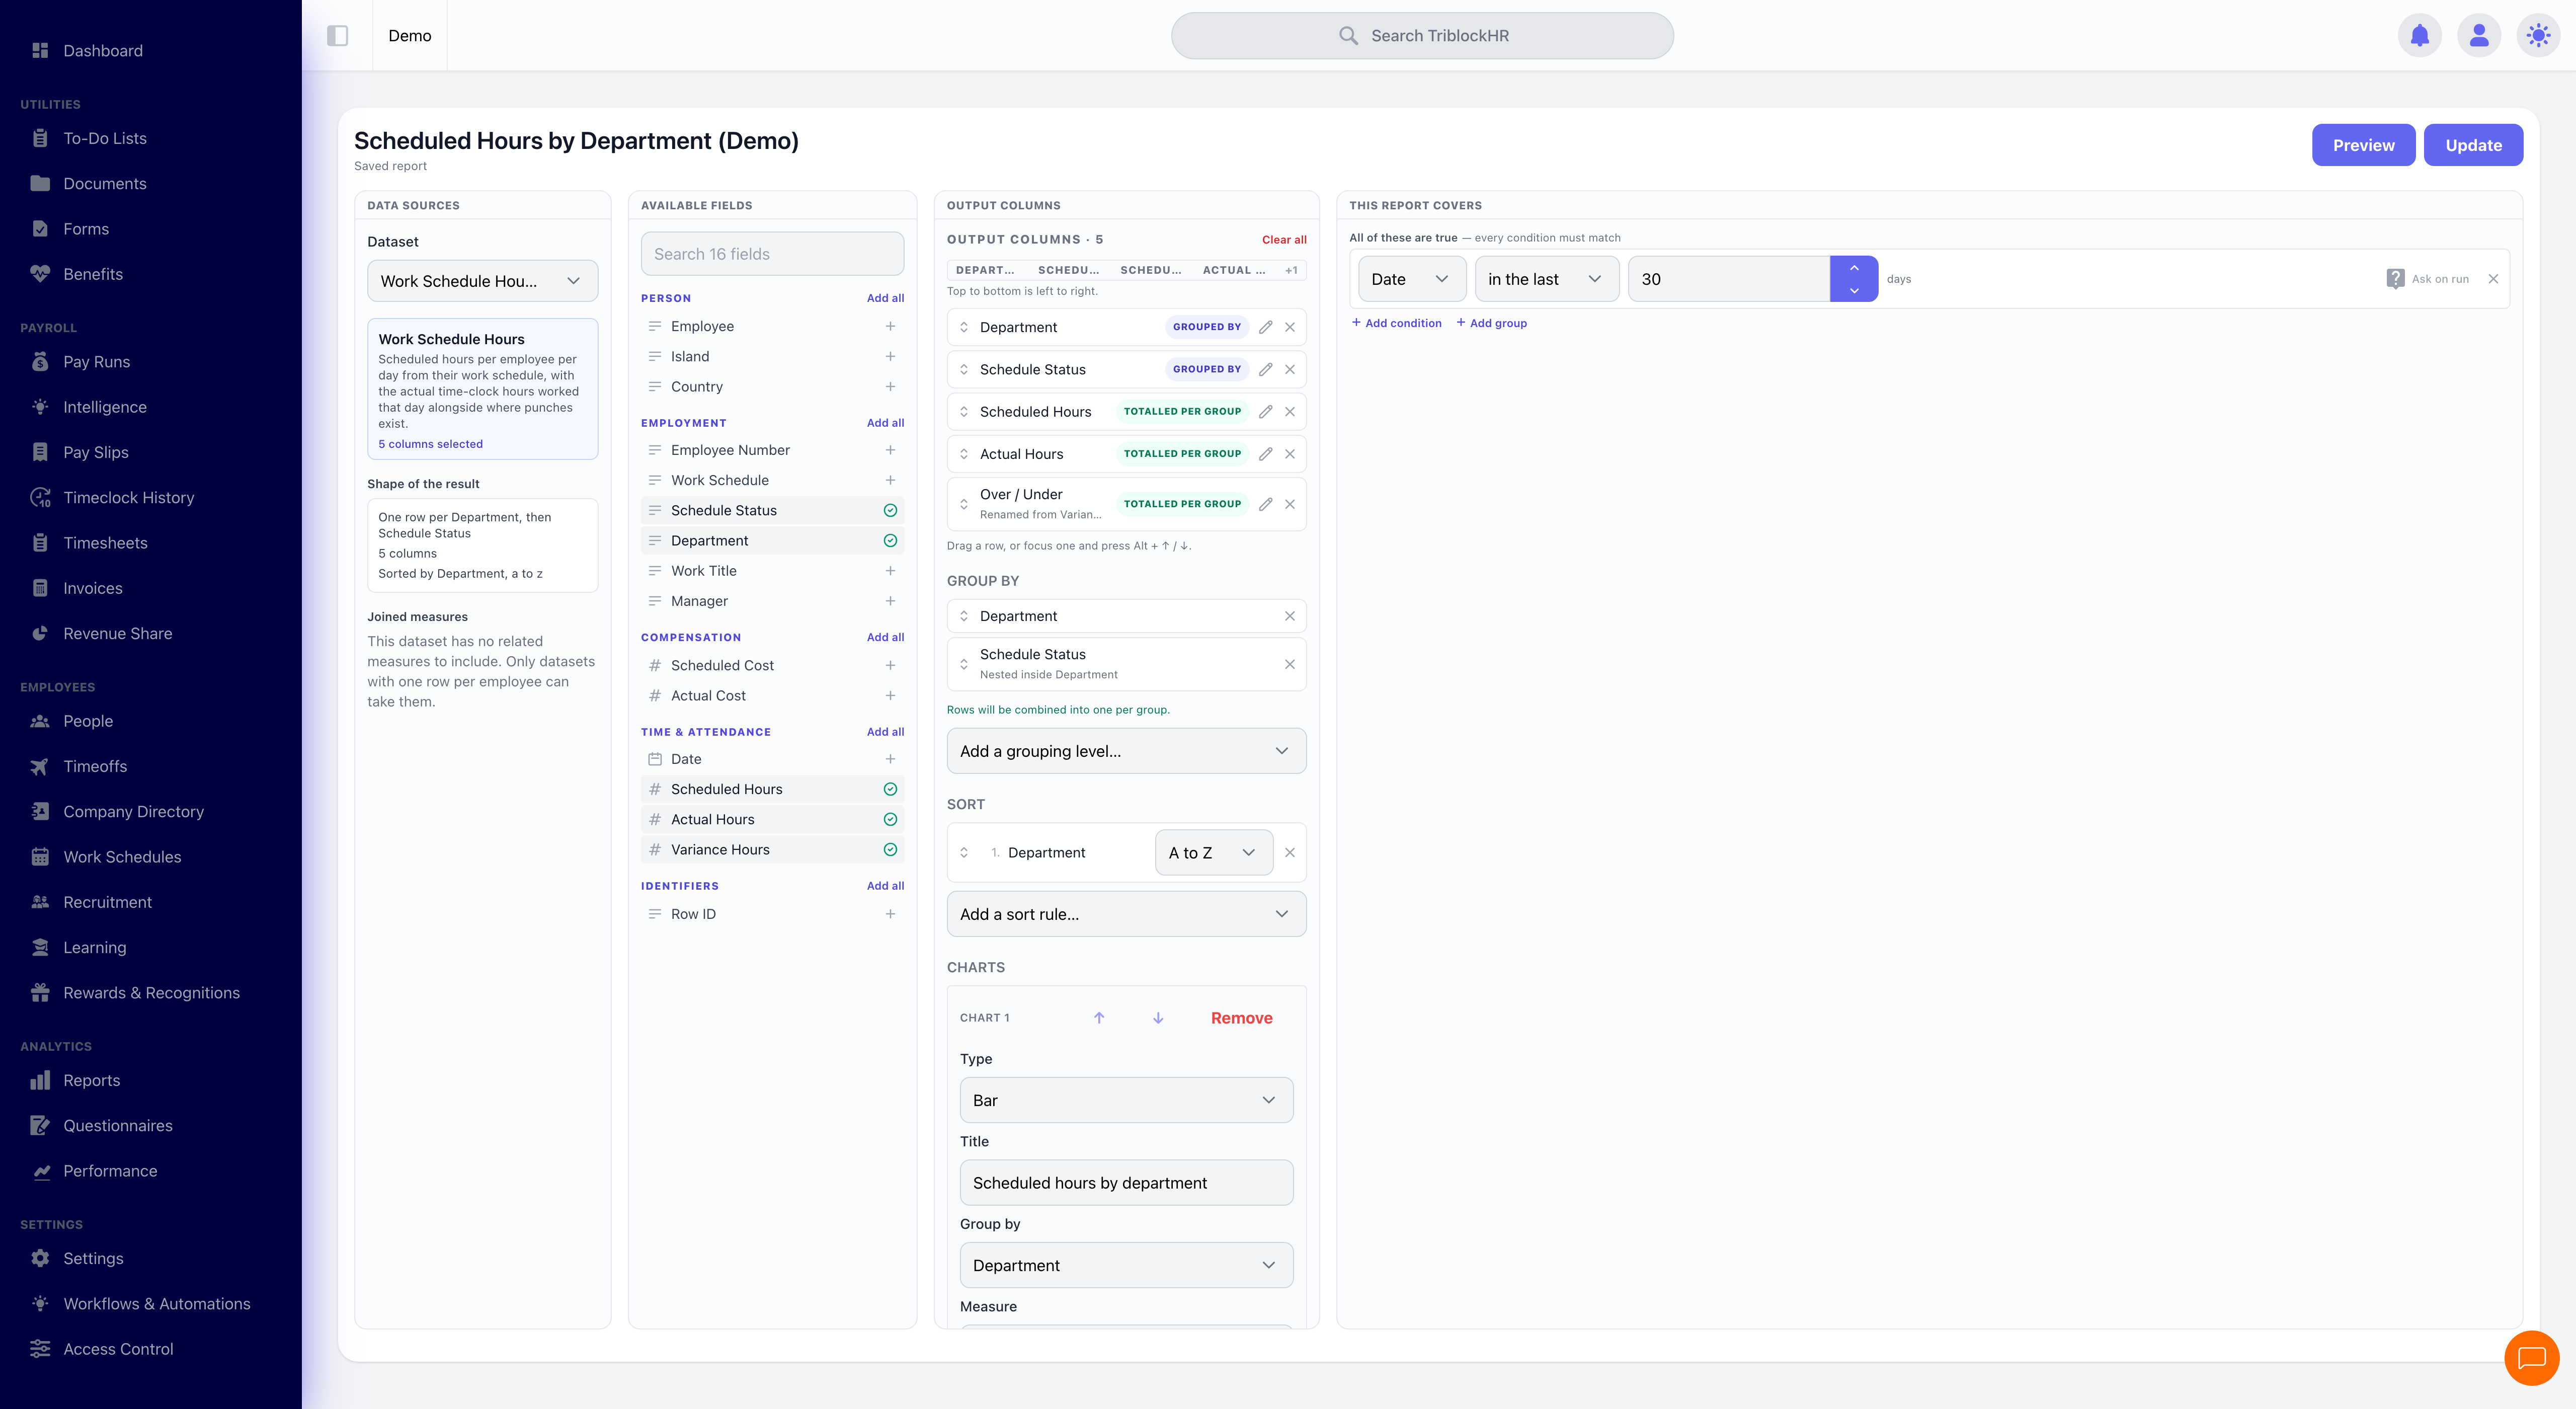
Configuring a chart
Save as: admin-guide__reports__custom-reports__shot2.png
Saving & sharing
Save the report with a visibility:
| Visibility | Who sees it |
|---|---|
| Only me | Just you. Good for works in progress. |
| Everyone in my account | Every administrator who can reach the underlying dataset. |
| Specific roles | Only the roles you name — for example, payroll reports visible to payroll staff only. |
Sharing a report never shares access to data: each person still sees only the employees their own role and scope allow.
The builder spells out the consequence before you commit — changing a report to account-wide says "Everyone in your account will be able to see this report from now on", and narrowing one back to yourself warns "Everyone else will lose access to this report. Anything scheduled from it keeps running." That last clause matters: restricting visibility does not stop a schedule that's already sending it. After saving you land on the saved report rather than back in a list.
A report you'll want to build variations of can also be saved as a template to start from next time.
Running & exporting
A saved report runs on demand from the reports list, and exports as Excel (.xlsx), CSV (.csv), or PDF (.pdf). Excel for onward analysis, CSV for loading into another system, PDF when it's going to a person rather than a spreadsheet.
Scheduling
Any saved report can run on a recurrence and email its output:
- How often — Daily, Weekly (choose the day), or Monthly.
- Who gets it — TriblockHR users, and any email address you type in. That last part matters: an accountant or auditor with no login can receive the monthly pack directly.
- What they get — the export format you chose, generated fresh at run time.
Pair a schedule with a relative date preset. Month to Date on a monthly schedule keeps reporting the right window forever; a Custom Range will still be reporting last March next March.
The Runs log records every execution with its status — Queued, Running, Succeeded, or Failed — plus row counts, duration, who ran it, and the error when one fails.
When it won't save
The builder validates a chart before letting it through. The messages say exactly what's wrong:
| Message | What to do |
|---|---|
| "Give the chart a title." | Every chart needs a title. |
| "Pick a column to group by." | A chart needs an axis. Only a KPI tile can stand without one. |
| "A KPI or pie cannot be broken down into series." | Remove the breakdown, or switch to a bar, line, or area chart. |
| "Break down by a different column than the one grouped by." | Grouping and breaking down on the same column produces nothing meaningful. |
| "Stacking needs a breakdown column." / "Small multiples need a breakdown column." | Add a breakdown first — there are no series to arrange without one. |
| "Pick either stacked or small multiples, not both." | They're two ways of showing the same breakdown. Choose one. |
| "That group-by column is no longer one of the report's columns." | You removed a column a chart depended on. Put the column back, or point the chart at one that's still there. |
| "Every filter needs a column." | A half-finished filter row. Complete it or remove it — a report whose filters could never run is refused rather than saved and left to fail later. |
| "Filters are nested too deeply." | Simplify the filter groups; there's a limit to how far sub-groups can nest. |
That last one is the common trap: charts reference columns by name, so pruning the column list can silently orphan a chart you built earlier.
From question to scheduled report (6–7 min)
Save as: admin-guide__reports__custom-reports__vid1.mp4