Reports
Sixty-plus built-in reports, a custom report builder, scheduled runs, and an analytics dashboard — organized so the one you need is findable.
Finding and running a report
The Reports index groups reports by domain — Employees, Payroll, Time, Allowances, Deductions, Recruitment, Forms, Work Schedules — plus a statutory section for your payroll country (only your country's filings appear). Most reports share the same controls: a payroll-cycle or month/year picker, employee filters (island, department, division, level, title), and a download button offering Excel and, on most statutory reports, PDF. Your saved custom reports and scheduled runs sit on the same index.
The report builder
When no built-in report answers your question, Create custom report opens the builder: choose a dataset, pick columns, stack filters, group and sort, add charts, and save it to run, export, or schedule like any other report.
It has a lot of depth — 32 datasets, four chart types, breakdowns, period comparison, and scheduling to outside email addresses. See The Custom Report Builder for the full walkthrough.
Scheduling and the run log
Any report can be scheduled to run on a recurrence and email its output to chosen recipients — the monthly statutory pack, a weekly headcount, whatever the rhythm needs. The Runs view (admin-only) logs every execution: status (Queued / Running / Succeeded / Failed), row counts, duration, who ran it, and the error when something fails.
Analytics
The Analytics page (admin-only) is a metrics dashboard rather than a report list: headcount trend, attrition and retention, promotion rate, absenteeism, hiring turnaround and time-to-hire, offer acceptance, salary-band adherence and drift, cohort survival — and pay equity, behind its own permission. Filter any period (month, quarter, year-to-date, custom) and compare across departments, islands, titles, divisions, or tenure cohorts.
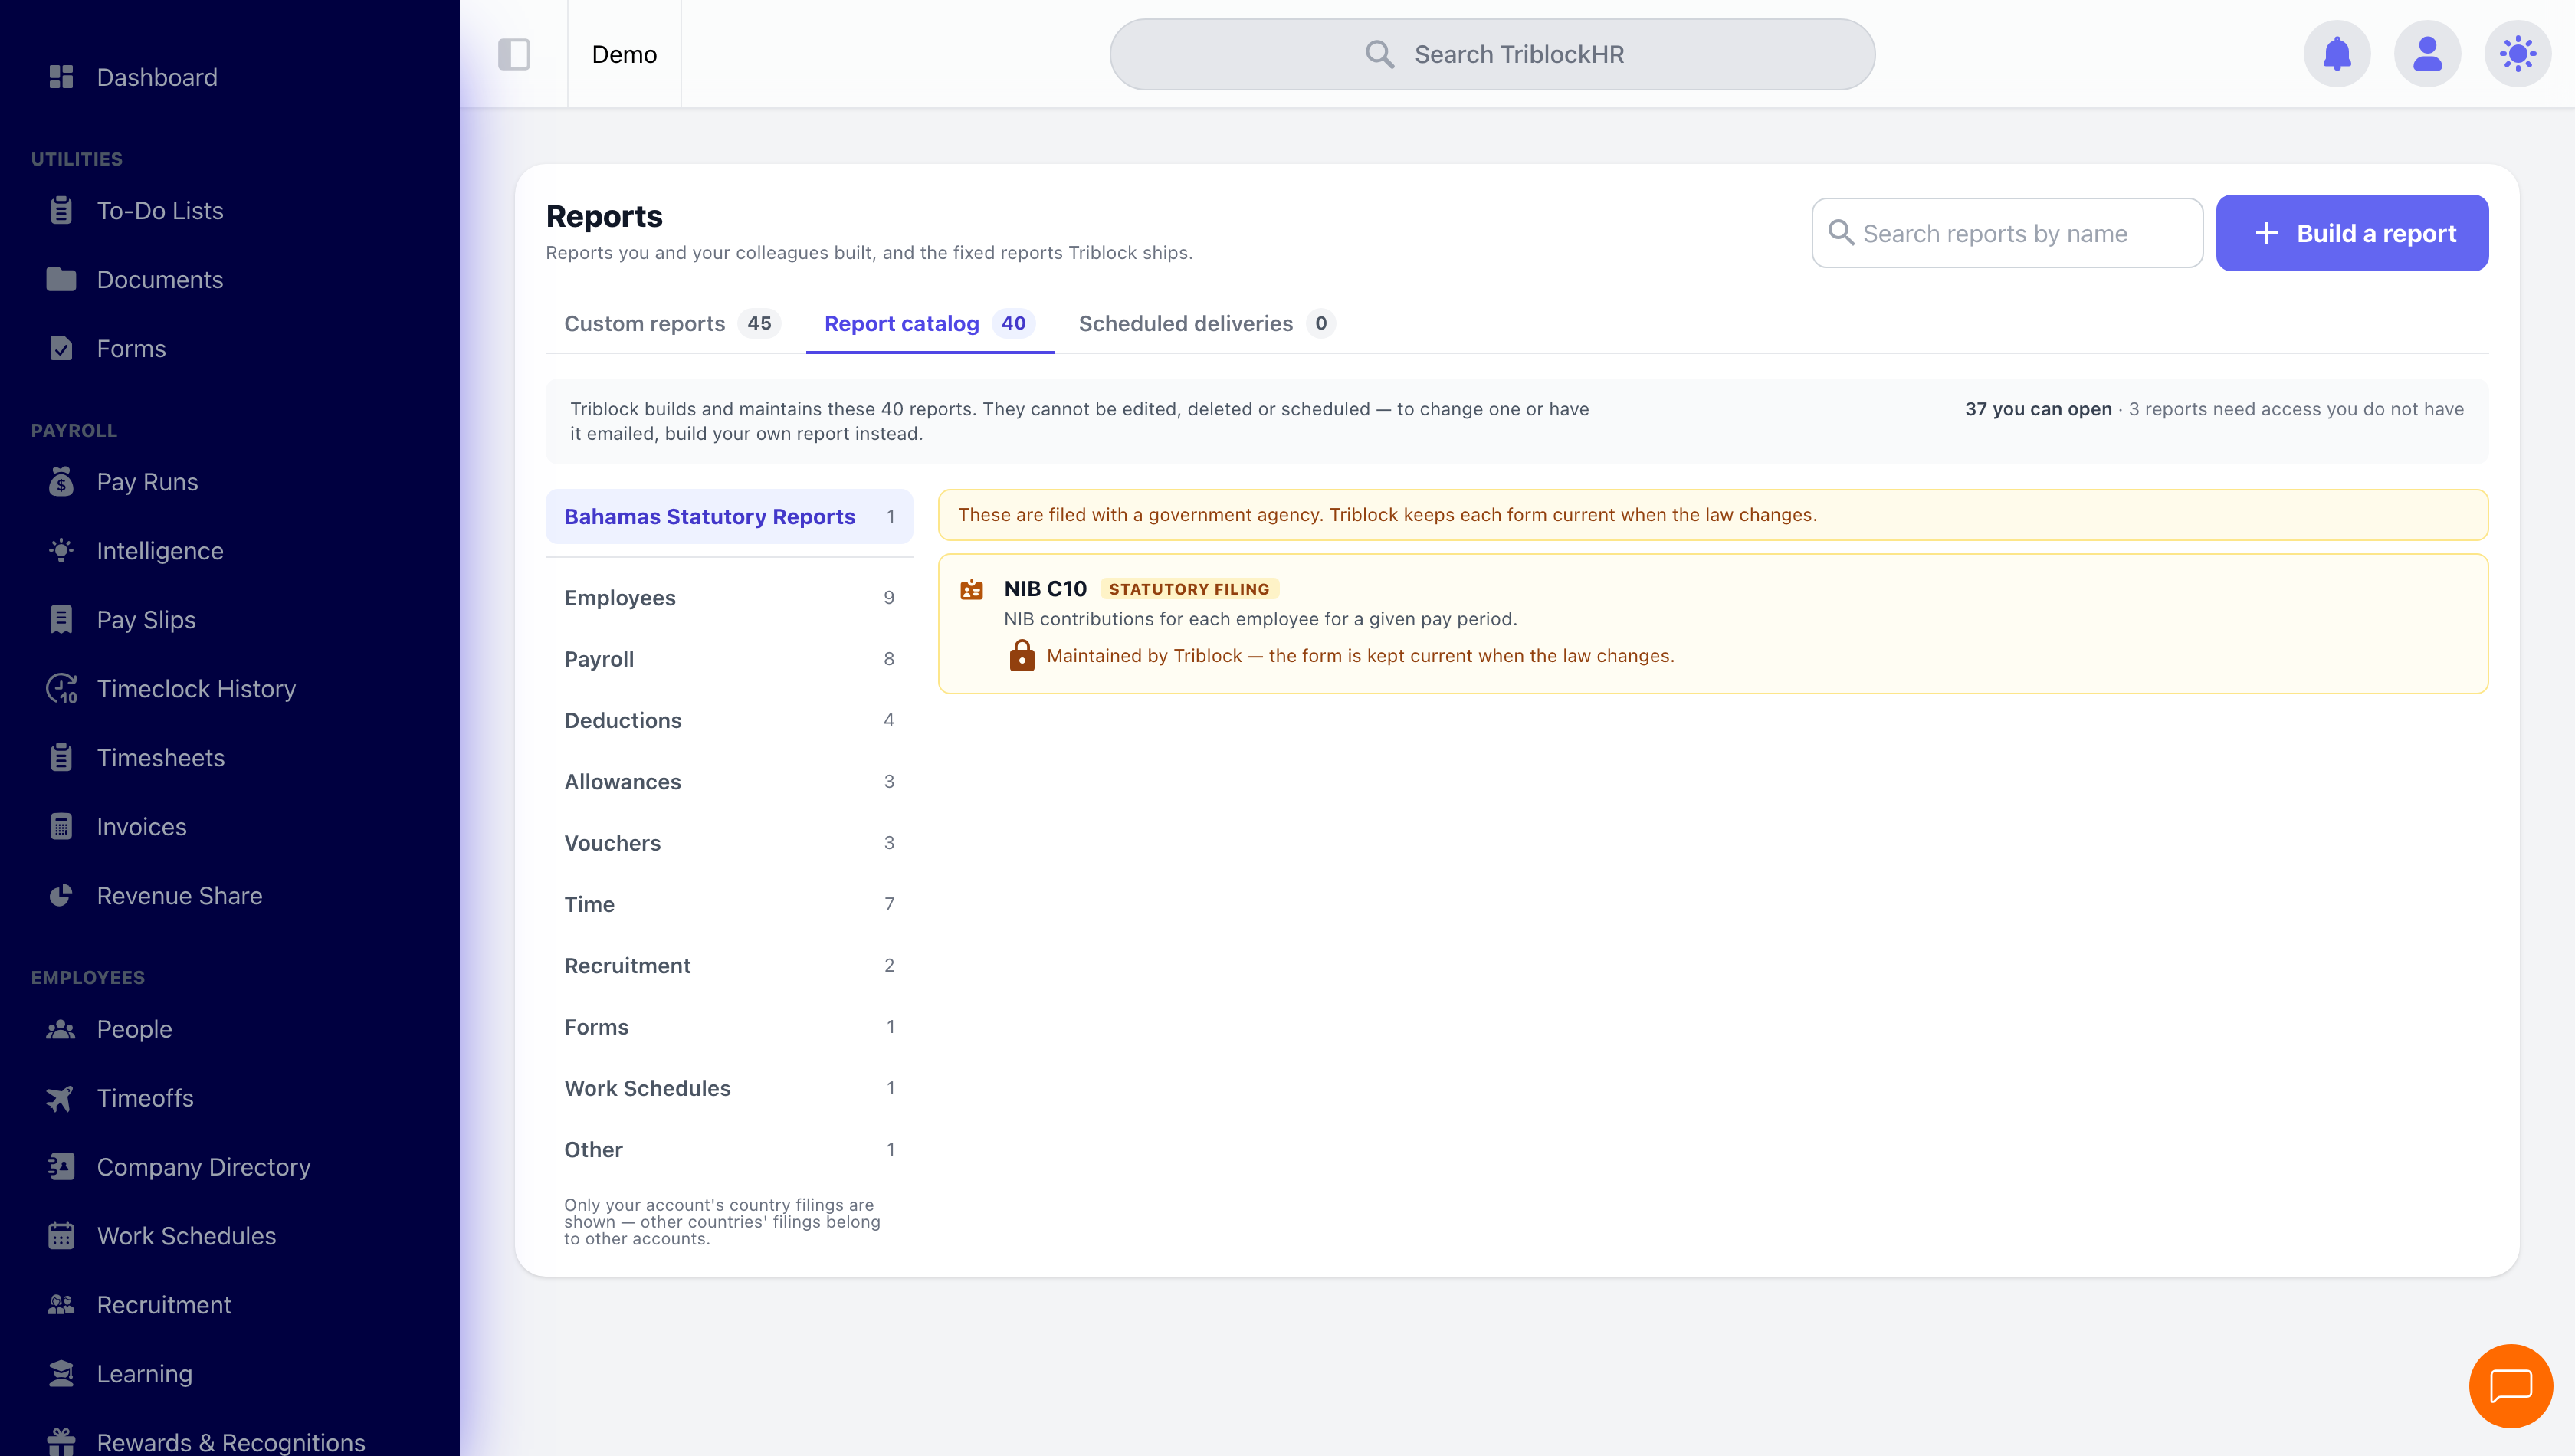
From question to scheduled report (4–5 min)
Save as: admin-guide__reports__index__vid1.mp4